Home selling prices are influenced by economic cycles, with expansion driving demand and recession curbing it. Regional dynamics play a role, as high-demand areas, such as the Western U.S., experience steeper costs. Local inventory shifts affect competition, while mortgage rates impact buyer affordability. Property features, such as energy-efficient designs, can enhance value by up to 8%. Construction costs and market trends also play a role. Exploring these elements further provides more profound insight into their critical pricing aspects.
Factors That Influence Home Selling Prices at Morgando Realty ServicesKey Takeaways
- Economic cycles influence home prices, with expansion driving demand and recessionary periods lowering prices.
- Regional variations influence pricing, as high-demand areas face increased competition, while surplus areas tend to moderate costs.
- Local inventory levels influence prices, with surpluses leading to declines and shortages increasing competition.
- Property features, such as energy efficiency and design, can significantly enhance a home’s value and appeal to buyers.
- Interest rates significantly impact affordability, with lower rates encouraging purchasing and higher rates deterring purchases.
Economic Trends and Market Cycles
How do economic trends shape the volatile landscape of home selling prices? Economic cycles, ranging from recovery to recession, have a direct impact on market dynamics. During expansion phases, high demand and low vacancies drive prices upward, as GDP growth fuels buyer confidence.
Conversely, recession phases, marked by high unemployment, erode demand, pushing prices down. Interest rates also play a critical role—lower rates spur buying, while rising rates dampen affordability. For those in our community navigating this, understanding these shifts offers valuable insights into pricing your home for sale.
Listing during early expansion enhances advantages, while price adjustments in hyper supply or recession phases prevent stagnation. By monitoring economic indicators, such as vacancy trends, sellers can strategically align with market cycles to achieve the best outcomes. Additionally, recognizing the recovery phase can be key, as low property prices often present unique opportunities for sellers to attract buyers.
The current inventory growth in Sarasota further emphasizes the need for competitive pricing strategies to avoid extended market times.
Regional and Location-Specific Dynamics
Home prices change a lot depending on where you live. The West has the highest prices, while the Midwest is the most affordable. For example, rent prices in California are almost three times higher than in Mississippi! In busy places like coastal California, there aren’t enough homes for everyone, which drives up prices. However, in smaller towns with a higher number of homes available, prices tend to remain lower.
The Southeast offers an outstanding balance. Many areas offer affordable prices, warm weather, and strong job growth, making them popular among families and retirees. Florida, Georgia, and the Carolinas are attracting buyers who want more space and sunshine.
Median home prices also vary by state. In Iowa, the median price is about $230,600, while Hawaii tops the list at $975,500. No matter where you live, setting the right price can make a significant difference in how quickly your home sells and how much you receive for it.
Regional Price Variations
Disparities in home selling prices across the United States reveal significant regional and location-specific dynamics. Northeast markets consistently outperform national averages, demonstrating resilience against economic pressures, while the South, particularly Florida, faces heightened risks of price declines, according to CoreLogic analysis. The Mountain West and Hawaii struggle with weaker growth, with Hawaii experiencing a 4.4% year-over-year decline. Meanwhile, Western New York emerges as a growing market, defying broader trends.
Affordability challenges, intensified by mortgage rates of 6.63–7.04% in the first quarter of 2025, disproportionately affect high-cost regions. National median prices for existing homes rose 3.4% to $402,300, yet regional gaps persist, with the Midwest remaining the most affordable. These variations in homebuying locations shape value, connecting communities through shared economic realities and market challenges.
According to Chief Economist Selma Hepp, the spring homebuying season may present opportunities for market recovery. Understanding market dynamics can help sellers establish effective pricing strategies tailored to their specific region.
Local Inventory Impact
Fluctuations in local inventory levels greatly influence home selling prices across diverse U.S. markets. In California, for-sale inventory surged 36% year-over-year by April 2025, with active listings up nearly 50% in May 2025. Nationally, the Unsold Inventory Index rose to 3.8 months, reflecting slower sales. Sun Belt and Mountain West markets, such as Arizona and Texas, have exceeded their pre-pandemic inventory levels, while high-tier properties are facing early price declines.
Explore how inventory shapes your market with these insights:
- California’s inventory boom shifts advantage to buyers.
- Sun Belt builders’ incentives pressure resale prices.
- High-tier markets correct initially, followed by mid-tier markets.
- Listings that have been over 90 days offer hidden buyer opportunities.
- Regional disparities highlight location-specific price dynamics.
Understanding these trends enables communities to collaborate effectively in navigating housing challenges. Furthermore, the surge in for-sale inventory is driving price declines as sellers compete to attract buyers in a crowded market.
Inventory Levels and Demand Shifts
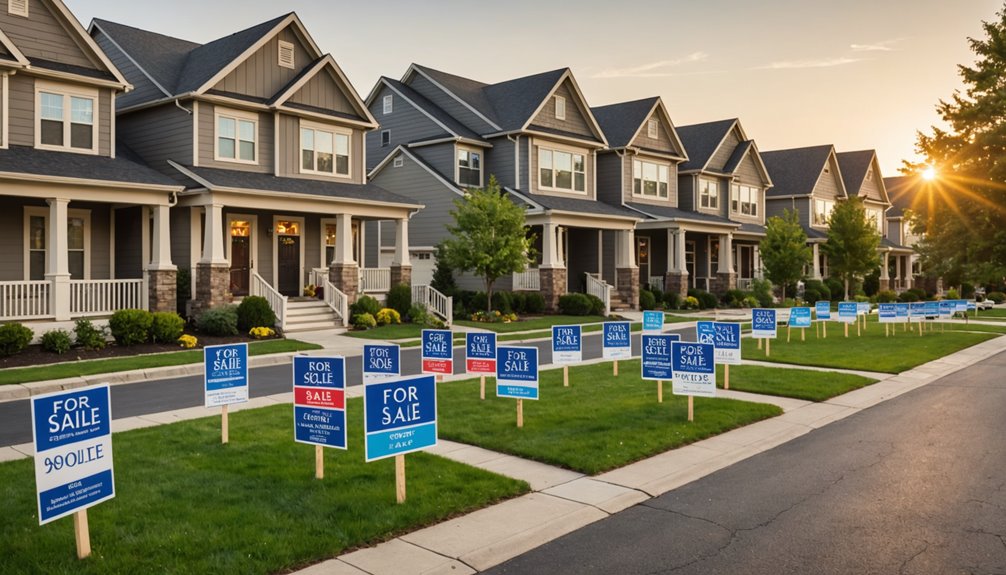
A critical factor in understanding home selling prices is the balance between inventory levels and shifts indemand across housing markets. Data reveals a national surplus, with sellers outnumbering buyers by nearly 500,000, creating tension that enables selective purchasing. Inventory stands 22% below pre-pandemic norms, yet a 36% year-over-year surge in California and a 9.3-month supply of new homes signal oversupply risks.
This imbalance, coupled with rising stale listings and a 20% increase in unsold value to $698 billion, puts downward pressure on prices. Additionally, the total months’ supply of new and existing homes at 4.4 indicates a low inventory environment, suggesting potential for limited price growth despite regional disparities.
Economists forecast a 1% price decline by late 2025, starting in high-tier markets where demand initially drops. For communities navigating these trends, understanding such metrics offers a shared lens to anticipate market shifts and adapt together.
Property Design and Key Features
Within the domain of property design and key features, the impact of color on home value emerges as a measurable factor, with data suggesting that neutral tones and strategically chosen accent colors can enhance buyer appeal and potentially increase selling prices. Furthermore, the benefits of energy-efficient design are increasingly significant, as features such as high-performance insulation and solar installations contribute to lower utility costs and attract eco-conscious buyers, often resulting in a competitive market edge.
Additionally, open-concept layouts are highly desirable, as they create a sense of spaciousness and enhance buyer appeal. Regularly implementing simple maintenance hacks can also bolster the overall attractiveness of the home, making it more appealing to potential buyers. These elements highlight how specific design choices can significantly impact a property’s financial performance in property transactions.
Color Impact on Value
The perception of a home’s value often hinges on color choices, both inside and out, as strategic selections can significantly influence buyer interest and final sale prices. Data from Zillow’s 2016 study shows strategic interior colors can elevate sale prices by an average of $5,000, with soft blues and greens in bedrooms often commanding higher offers. Exterior choices, such as a well-chosen front door color, can add $1,500 to the perceived value, while earth-toned siding aligns with modern trends.
Specific room colors, such as yellow in kitchens, can increase property value by an average of over $1,300.
Consider these impactful color factors:
- Bold, nature-inspired hues, such as deep greens, stand out against all-white interiors.
- White walls need warm accents to avoid a clinical feel.
- Blue evokes tranquility, resonating with buyers.
- Exterior coordination with neighborhood aesthetics improves curb appeal.
- Regional preferences, like UK buyers’ 5% penalty for unappealing colors, matter.
Energy-Efficient Design Benefits
Homebuyers are increasingly valuing energy-efficient design as a key factor in determining property worth, shifting their focus from aesthetic elements like color to structural and systemic advantages. Data reveals a consistent price premium for energy-efficient homes, with Freddie Mac studies showing an average increase of 2.7%, and regional premiums reaching up to 8% in the Pacific Northwest. Certifications like ENERGY STAR and RESNET add measurable value, often elevating prices by 2-5%.
| Region | Price Premium |
|---|---|
| Texas | 6% (ENERGY STAR) |
| Maryland | 2-5% (Certified) |
| Pacific Northwest | Up to 8% |
| California | 2.1% (Certified) |
Such features, including advanced HVAC systems and sustainable materials, resonate with a community that prioritizes long-term savings and environmental responsibility, thereby enhancing market appeal.
Builder Strategies and Construction Costs
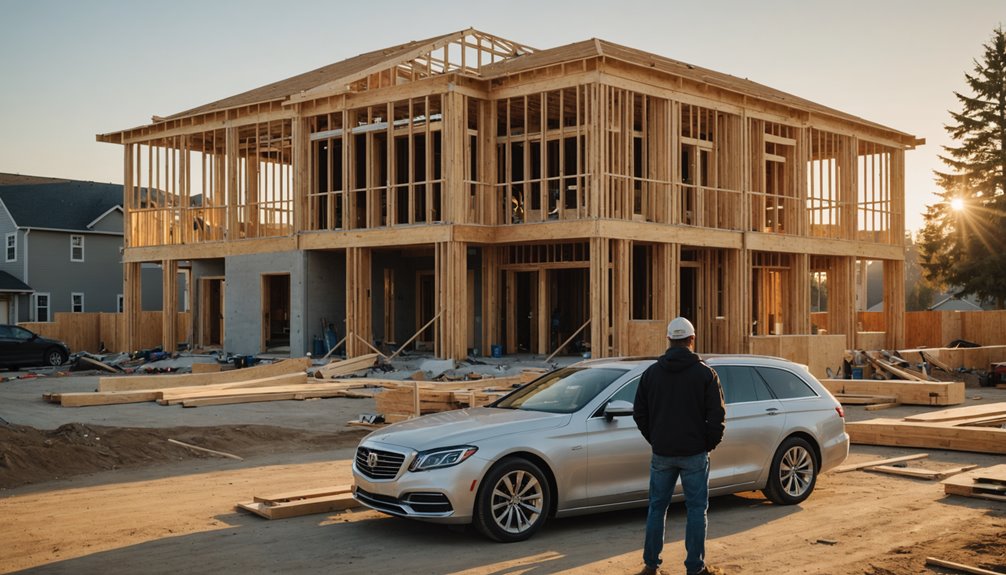
Examining the landscape of home construction, builders face escalating costs that greatly influence home selling prices, with construction expenses reaching a record high of 64.4% of sales prices in 2024, up from 60.8% in 2022. Material inflation, accounting for 60% of expenses, drives this surge, while builders adapt through strategic cost management. Tactics include optimizing square footage for larger homes and negotiating subcontractor markups of 10-20%.
Key cost factors include:
- Interior finishes: 24.1% of costs ($103K avg)
- Major systems rough-ins: 19.2% ($82K avg)
- Framing: 16.6% ($71K avg)
- Material selection: Balancing quality and affordability
- Personalization: Upgraded features increase pricing
These strategies shape market trends, helping builders and buyers navigate rising costs together in a challenging environment. Furthermore, accurate records of significant upgrades are essential for supporting home value in the competitive market.
Mortgage Rates and Buyer Affordability
As mortgage rates continue to shape the housing market, their projected stability in the 6-7% range for 30-year fixed loans in 2025, with occasional spikes above 7%, signals ongoing challenges forhome affordability. These heightened rates, far above pre-2021 levels, compress purchasing power and increase monthly payments, straining budgets for many in the homebuying community.
Data show a 25% year-over-year rise in purchase applications, reflecting buyers adjusting to this environment, while a 56% surge in refinance applications indicates that others are seeking relief. Yet, with rates nearly flat since January 2025 and the Federal Reserve cautious on cuts due to inflation, affordability gaps persist. This shared struggle underscores the need for strategic planning among buyers traversing today’s market realities.
Housing Valuation and Price Growth
While mortgage rates continue to challenge affordability, the trajectory of housing valuation and price growth reveals a complex landscape shaped by national trends and regional disparities. U.S. home prices grew 4.7% year-over-year in Q1 2025, though forecasts from Zillow predict a 1.4% decline for the year due to rising inventory. Regional variations are stark, with states like Connecticut seeing 8.4% gains while Louisiana lags at 1.0%. Inventory levels, at their highest since 2007, shift advantage to buyers, cooling price competition.
Key insights include:
- National growth is slowing from 5.5% in Q4 2024.
- Twenty-six states exceeded the 4.7% average growth rate.
- New home inventory at 481,000 units.
- Long-term projection of 1a 9.4% value increase by 2029.
- Buyer caution amid economic uncertainty.
Local Market Conditions and Competition
Across the country, local markets play a significant role in home prices. Factors such as the number of homes for sale and the rate at which they sell can vary significantly from one region to another. Currently, the U.S. has a 4.6-month supply of homes, indicating that there are still more buyers than available homes. In fact, listings are up almost 29% from last year, so buyers have more options.
The Southeast is full of excitement! Cities like Cape Coral and other Florida spots give buyers more choices, making it easier to find a dream home. This region is experiencing rapid growth, thanks to its warm weather, job opportunities, and numerous new communities.
The Mid-Atlantic, including areas such as Washington, D.C., and Virginia, is experiencing mixed results. Some areas have softer prices, which is excellent for buyers, while others remain steady.
In the Northeast, states such as New Jersey and New York are experiencing price increases of nearly 7%. Hot markets like Buffalo and Hartford are moving fast, which is excellent news for sellers.
Even with challenges such as higher interest rates and rising prices, areas with strong job growth and excellent lifestyles—especially in the Southeast—are still attracting numerous families. It’s an exciting time for anyone ready to make a move!
Frequently Asked Questions
How Do School Districts Impact Home Prices?
School districts have a significant impact on home prices, as data shows that a 1% rise in student proficiency correlates with price increases of $513–$620. Strong districts attract buyers, fostering community appeal and driving demand in desirable neighborhoods.
What Role Do Neighborhood Amenities Play?
Neighborhood amenities powerfully shape property values. Well-maintained parks, accessible public transportation, and vibrant retail hubs enhance the appeal, fostering a sense of community connection. Data shows price premiums of 5-42% in areas with such desirable, inclusive features.
How Does the Crime Rate Affect Property Value?
Crime rates substantially impact property values, as data shows high crime deters buyers, reducing prices by 3.99% for property crime and 2.67% for violent crime. Proximity to hotspots further depresses values, affecting community desirability.
Can Public Transportation Access Influence Pricing?
Like a magnet, public transportation access draws homebuyers. Data shows properties near transit hubs command a 42% premium, enhancing value retention by 41.6%. Such connectivity unites communities, making neighborhoods desirable and prices robust.
Do Historical Landmarks Nearby Boost Value?
Historical landmarks nearby often elevate property values, with data showing increases of 5-20% in designated areas. Such proximity fosters community pride and cultural connection, enhancing the appeal of homes in these neighborhoods.
Conclusion
To sum up, home selling prices are shaped by a complex interplay of economic trends, location dynamics, inventory levels, property features, builder strategies, mortgage rates, valuations, and local competition. Strikingly, studies reveal that homes in high-demand areas can sell for up to 20% more than comparable properties in less desirable locations, underscoring the profound impact of regional disparities. This statistic underscores the crucial importance of buyers and sellers carefully evaluating market nuances.
References
- https://eyeonhousing.org/2025/06/house-price-appreciation-by-state-and-metro-area-first-quarter-2025/
- https://www.fixr.com/articles/real-estate-statistics-and-trends
- https://www.bankrate.com/real-estate/housing-market-2025/
- https://www.jpmorgan.com/insights/global-research/real-estate/us-housing-market-outlook
- https://www.nar.realtor/sites/default/files/2025-04/2025-home-buyers-and-sellers-generational-trends-04-01-2025.pdf
- https://www.masterclass.com/articles/real-estate-cycle-explained
- https://visuallease.com/understanding-real-estate-market-cycle-for-cre-market-analysis/
- https://butterflymx.com/blog/real-estate-cycle/
- https://swiftlane.com/blog/uncovering-the-real-estate-cycle-4-stages-of-investing/
- https://www.crowdstreet.com/resources/investment-fundamentals/real-estate-cycle-phases

Gina Morgando is a licensed Broker & Realtor serving Sarasota, Manatee, and Palm Beach Counties. With over 10 years of experience, she helps buyers, sellers, and investors make confident real estate decisions across Florida.